


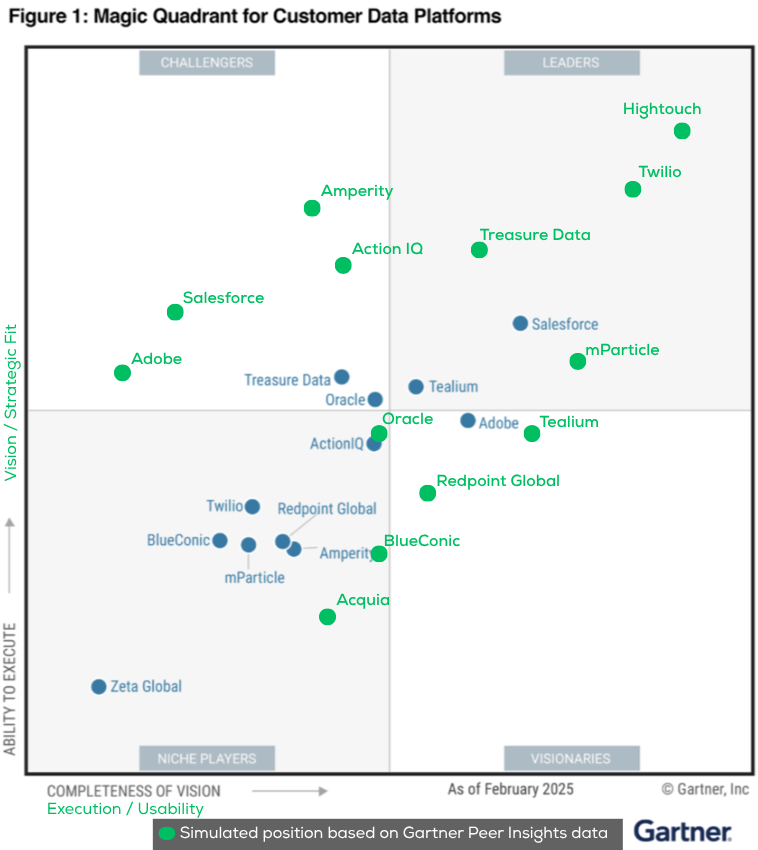
Gartner’s Magic Quadrant is treated like gospel in boardrooms from Dubai to Düsseldorf. A single position in that familiar matrix can nudge millions in Martech budgets from one vendor to another. The thing to keep in mind is that the Quadrant doesn’t measure what many buyers think it does. It rewards size, vision, and analyst choreography, and not necessarily real-world usability, implementation speed, or practitioner satisfaction. It reflects power structures, and rarely performance.
This first part in the Rethinking the Quadrant series takes aim at the mechanics behind those polished charts and asks a blunt question:
What kind of success are we actually rewarding and at what cost to innovation, efficiency, and relevance?
Author’s note: This article is not a statement of fact about Gartner as a whole, but rather an individual perspective based on publicly available information and my own professional experience. It is not affiliated with or endorsed by any vendor or analyst firm mentioned or implied. The views in this article are my own, shaped by years of hands-on Martech work across regions and verticals. I was prompted to explore this topic by recurring themes in community forums and practitioner groups, as well as my direct experience helping clients in Europe migrate away from companies labeled as 'Leaders' in the analyst charts to tools that solved their specific problems. That said, I’ve also worked closely with C-level decision-makers, particularly in the Middle East, who rely heavily on analyst validation for strategic procurement.
I understand and acknowledge why Gartner’s Magic Quadrant carries weight.
My goal here isn’t to dismiss it outright, but to open a more grounded discussion about how it’s used, where it helps, and where it doesn’t.
How the Quadrant gets made (and who gets left out)
Let’s start with how a vendor gets placed on the Magic Quadrant in the first place. The evaluation process isn’t as neutral as it looks. Inclusion requires hitting revenue thresholds, participating in months-long briefings, submitting detailed documentation and recorded videos, and lining up customer feedback. In theory, this ensures quality. In practice, it filters for size, polish, and the ability to play the game.
As Brightwork Research notes in a 2019 article:
"Gartner’s content clearly shows a significant vendor bias... small innovative guys are running uphill against the Gartner wind."
That uphill climb often begins before the product is ever evaluated at the threshold of who even gets a seat at the table.
Prominent vendors have entire teams dedicated to analyst relations. They know how to speak the language of "completeness of vision". They prepare meticulously for every briefing, craft layered narratives around long-term strategy, and come equipped with roadmap slides that stretch five years into the future. Whether those promises are deployable or will be “GA” (generally available) within six months is a different question.
And then there’s the “execution” axis. Contrary to the name, it isn’t just about feature delivery or user success. Execution includes market presence, sales reach, brand power, and, yes, marketing muscle. It’s entirely possible to land in the Leader quadrant while your product is still in flux, as long as the story is compelling enough and your customer logos are prominent. This is how we end up with tools that win analyst accolades but confuse actual users or worse, stall projects before value is delivered.
Some vendors even optimize their product development roadmaps around what will impress analysts, not end users. A few visible AI features, bundled integrations, or cloud-native claims can sometimes sway more influence than six months of genuine usability work.
Why vision wins over usability (and what that costs us)
Gartner isn’t alone in this. Most analyst frameworks reward the same behaviors, including maturity, revenue, enterprise focus, and cross-sell potential. But that means the most hyped products are often those that already dominate the enterprise landscape. Innovation, modularity, usability- these matter less than platform sprawl and strategic vision.
Let’s not pretend it’s just about features, or even to be named a Leader in an analyst report. Gartner’s CDP Magic Quadrant, for instance, repeatedly elevates vendors that check the right boxes on breadth, not depth. This has led to some absurd outcomes, including tools with patchy real-time orchestration, confusing identity resolution, or high setup friction, still show up as Leaders, while composable, high-performing alternatives (even some CEPs/MAPs with similar features) are left out entirely for not hitting minimum revenue thresholds.
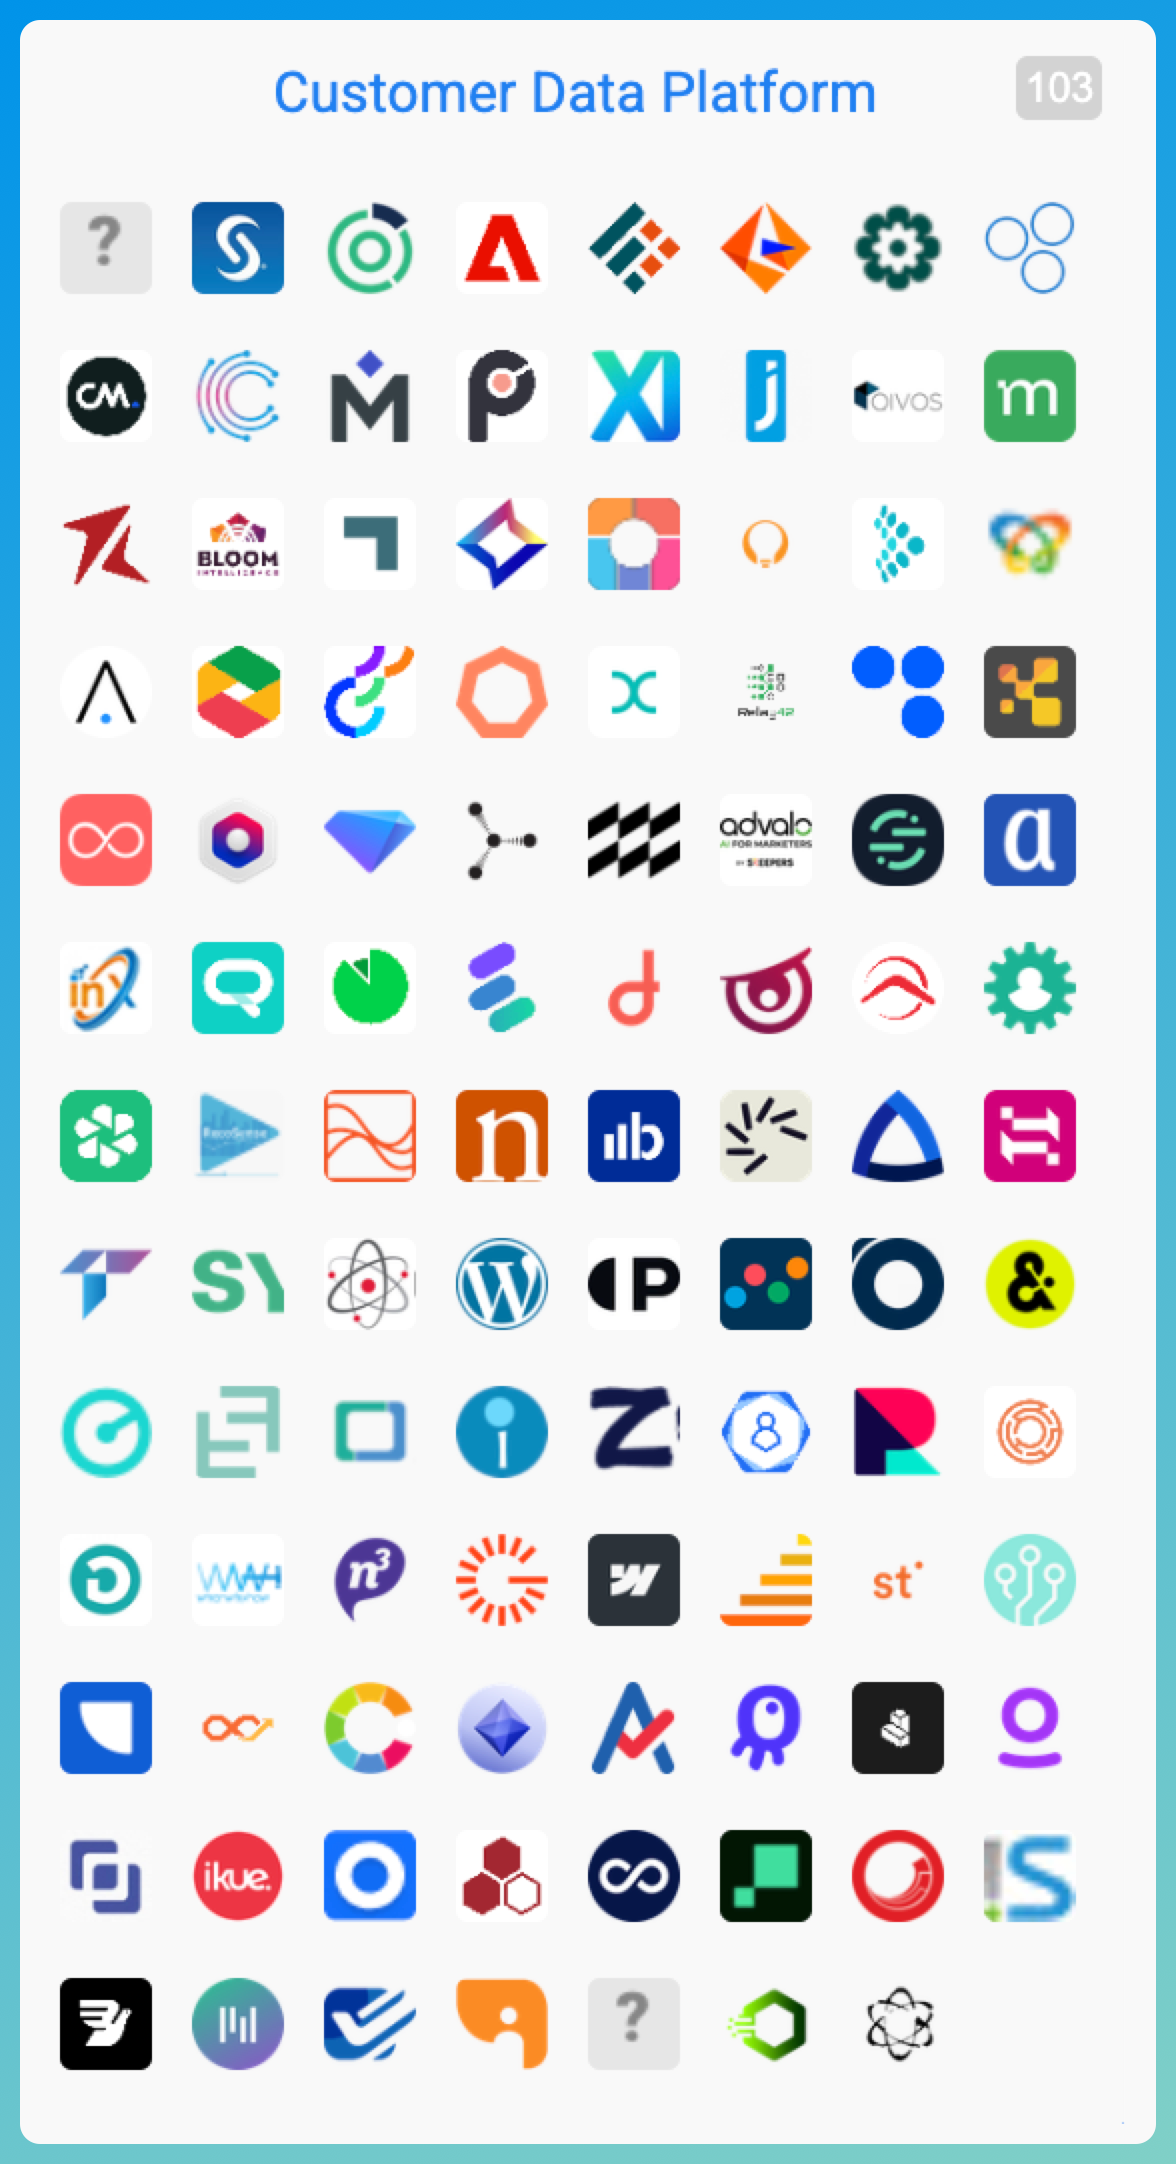
It’s not always malicious, and I want to make that very clear. It is not easy to build insights like this for an industry that never rests. In Gartner’s defense, placing 100+ vendors on the quadrant would only increase the confusion. It’s just baked into an existing scoring system, which I feel cannot keep pace with the changes in the market. A new form of Martech’s law, but for analyst firms, perhaps? The Gartner Magic Quadrant gives weight to criteria that vendors with large sales teams, acquisition capital, and decades of category presence more easily fulfil. That shapes the playing field long before the buyer sees the grid.
One practitioner put it this way on a Reddit thread discussing CDP selection:
"If you can afford to dance the analyst dance, you’re already two quadrants ahead."
That’s pattern recognition if I ever saw it, voiced by someone who’s seen how procurement really works in enterprise Martech, maybe just as you have.
Why other CDP feature-filled tools rarely make the grid
Rarely, if ever. Composable vendors and Marketing Automation Platforms (MAPs) ** have seen significant market traction, particularly with mid-market and modern data teams. But because they don’t package themselves as suite platforms or because they’re intentionally lean, modular, and in the case of composable CDPs, warehouse-native, they often miss the Magic Quadrant cutoff.
** Tools like Braze seem to be categorized under Multi Channel Marketing Hubs, while Bloomreach is seen as Customer Engagement Platform. Categories get confusing and are often not related to features built-in to the various solutions.
And if they’re not on the quadrant, they’re not even considered in RFPs where Magic Quadrant inclusion is a requirement (I will touch more on that in part 2). It’s a self-fulfilling loop that keeps newer entrants out and entrenched incumbents looking shiny. This is particularly frustrating for buyers who are actually trying to move away from monolithic systems.
The irony? These composable tools and CEPs/MAPs with CDP features built-in are often the ones fixing the problems that initially led to the suites, like rigid workflows, black-box identity graphs, overpriced licensing, and year-long implementations. As one vendor engineer noted on a LinkedIn thread, "we’re often brought in after a monolithic CDP failed to deliver in time for a product launch." They’re solving for transparency, agility, and developer control, but none of that shows up in the chart.
Composable vendors also challenge the very idea of a suite-based CDP. Many buyers now prefer using their own data warehouse with flexible activation tools. But because that model doesn’t fit cleanly into the traditional CDP narrative, it is often overlooked by legacy frameworks. In a way, the quadrant doesn’t just exclude new tools… it excludes new thinking. And it is how this propagates to boardrooms that worries me.
Why this pattern repeats across Martech
If it were just about CDPs, we could write this off as a niche Martech frustration. But the same structural issue shows up in every analyst-led category: MAPs, DAMs, CRMs, CMS platforms. The bigger the vendor, the more points they can rack up for strategy. Meanwhile, buyers assume that ‘Leader’ = best product, best results.
That assumption, unquestioned in too many executive meetings, is costing teams time, energy, and ultimately, effectiveness. Tools get chosen because they look good in a boardroom, not because they solve problems quickly or scale with evolving needs.
It also reinforces a dangerous procurement shortcut → if it’s in the upper right quadrant, buy it. That’s a simple abdication and a risky reliance on external insights. And it creates a false sense of consensus around tools that many practitioners quietly struggle to use. Behind closed doors, even on platforms like LinkedIn, you’ll hear stories of CDPs that took 12 months to deploy and still can’t build a basic customer journey. But those stories rarely make it into analyst briefings.
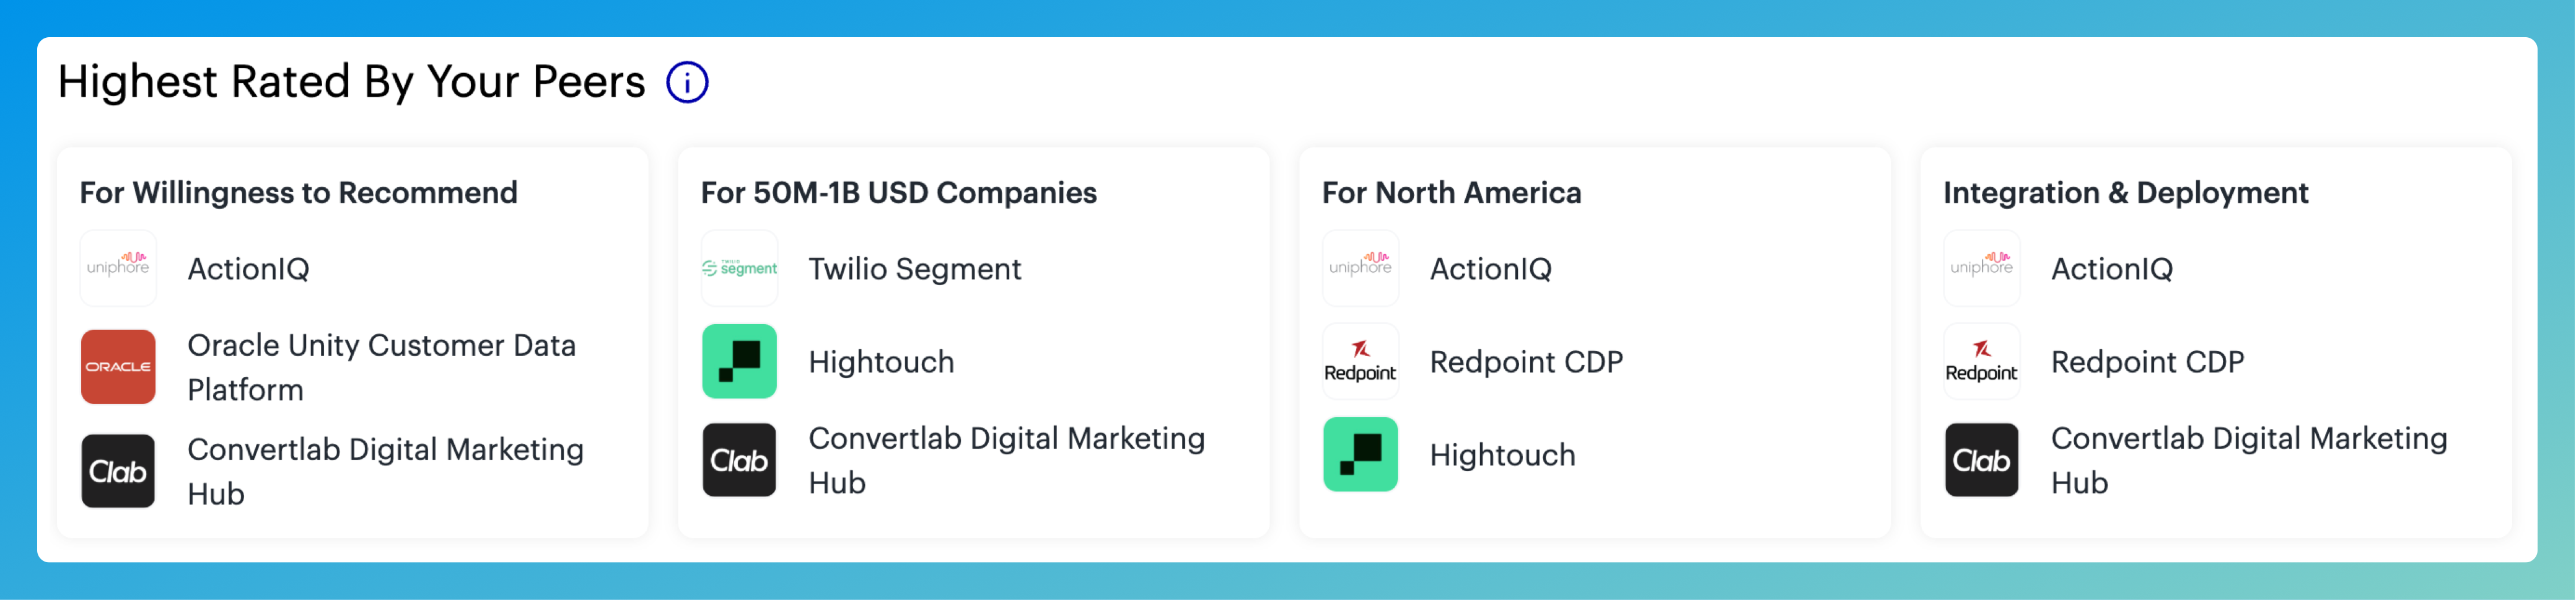
Even Gartner’s own Peer Insights platform hints at this disconnect. Several top-ranked Magic Quadrant vendors receive mixed or lukewarm reviews from real users, flagging complexity, setup delays, or mismatched expectations. But since Peer Insights plays no direct role in quadrant placement, these voices rarely shift perception at the board level.
But before you go cheering the Peer Insights initiative, it seems better than nothing… true, but note that Gartner gives money incentives to elicit reviews from end users, and vendor influence of the same is a black hole all of itself. I have worked with qualitative data solutions in the past, and incentives are rarely unavoidable and come with a plethora of problems.

The Peer Insights, to a large extent, seem to be genuine, but some do make you think. As one commenter on last week’s LinkedIn post announcing the series noted:
“Also, if you look at some of the peer reviews, you will see that there are other issues with the way they are rated. For example, if a vendor has 50 perfect reviews with 100% willingness to recommend.“
Below are some examples of Peer Insights likes and dislikes for three vendors:
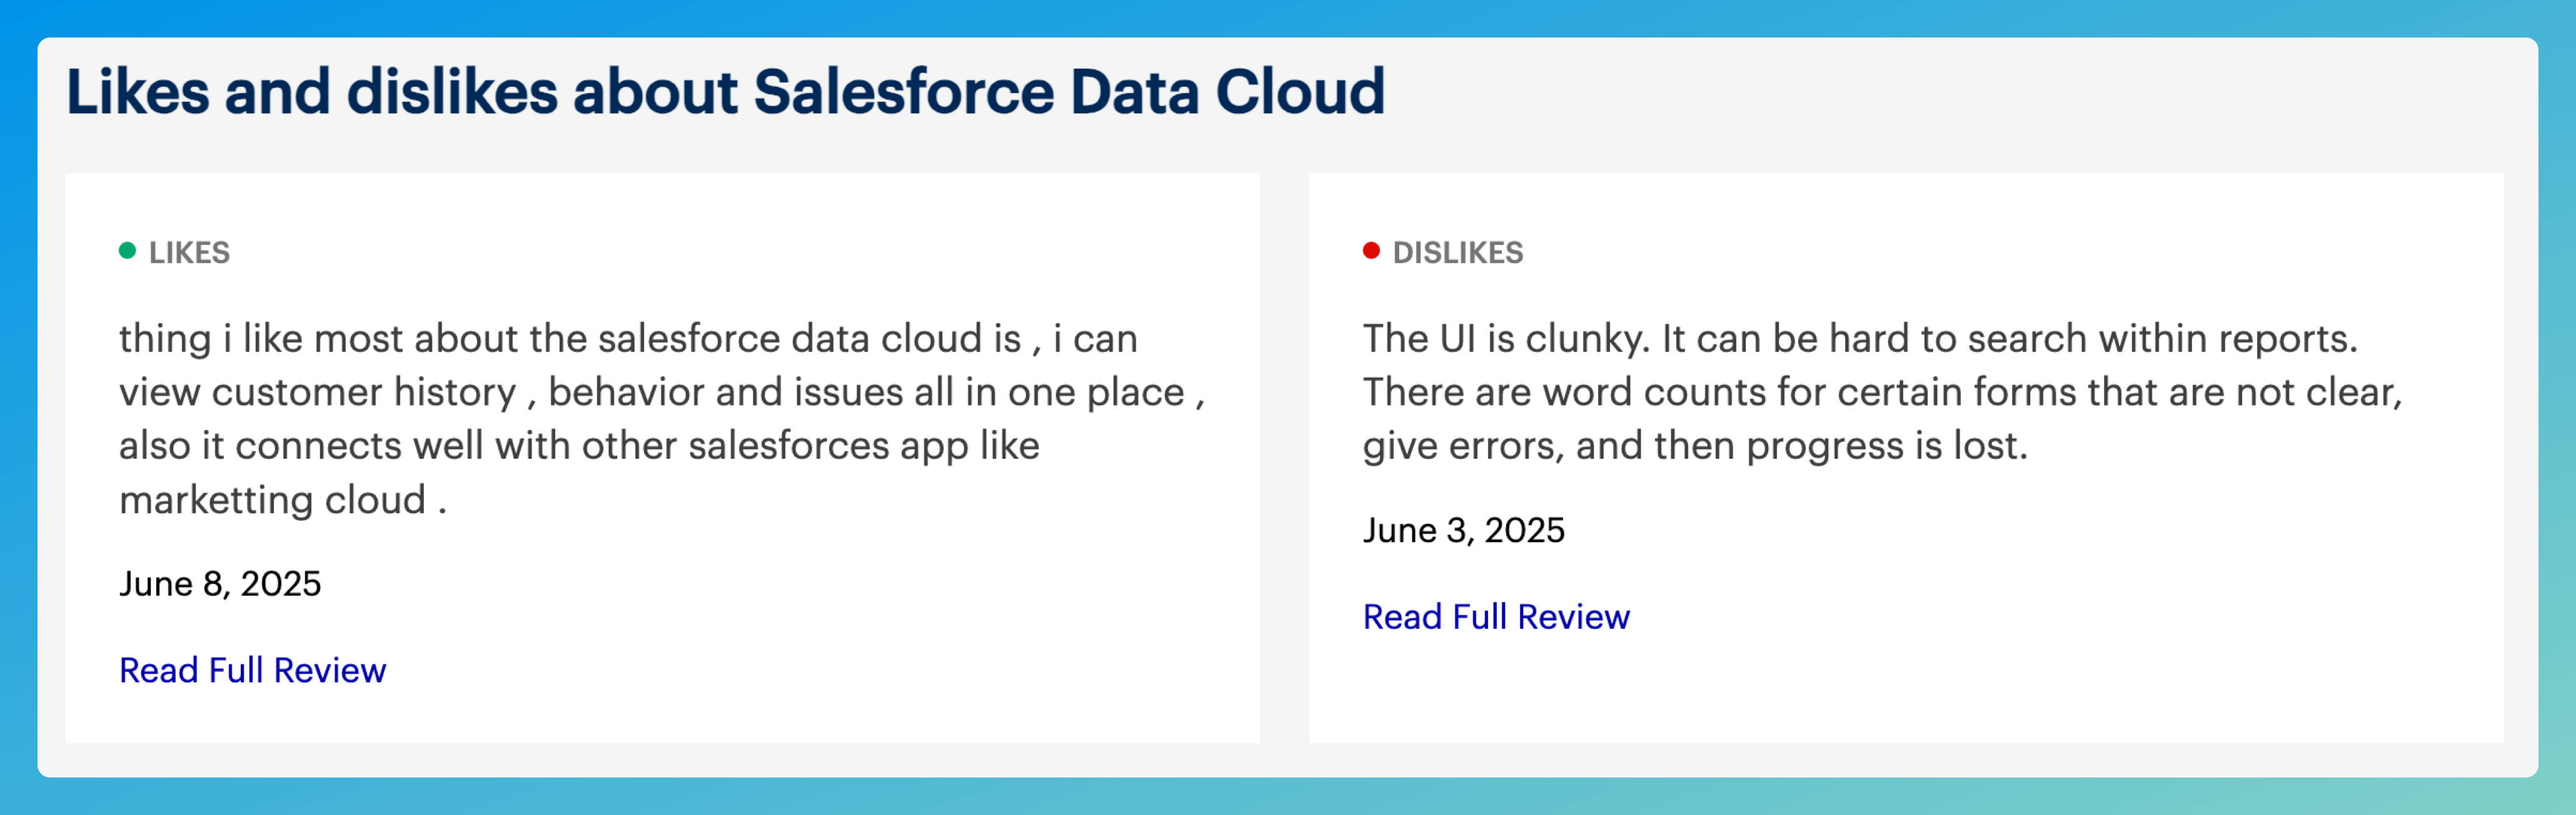
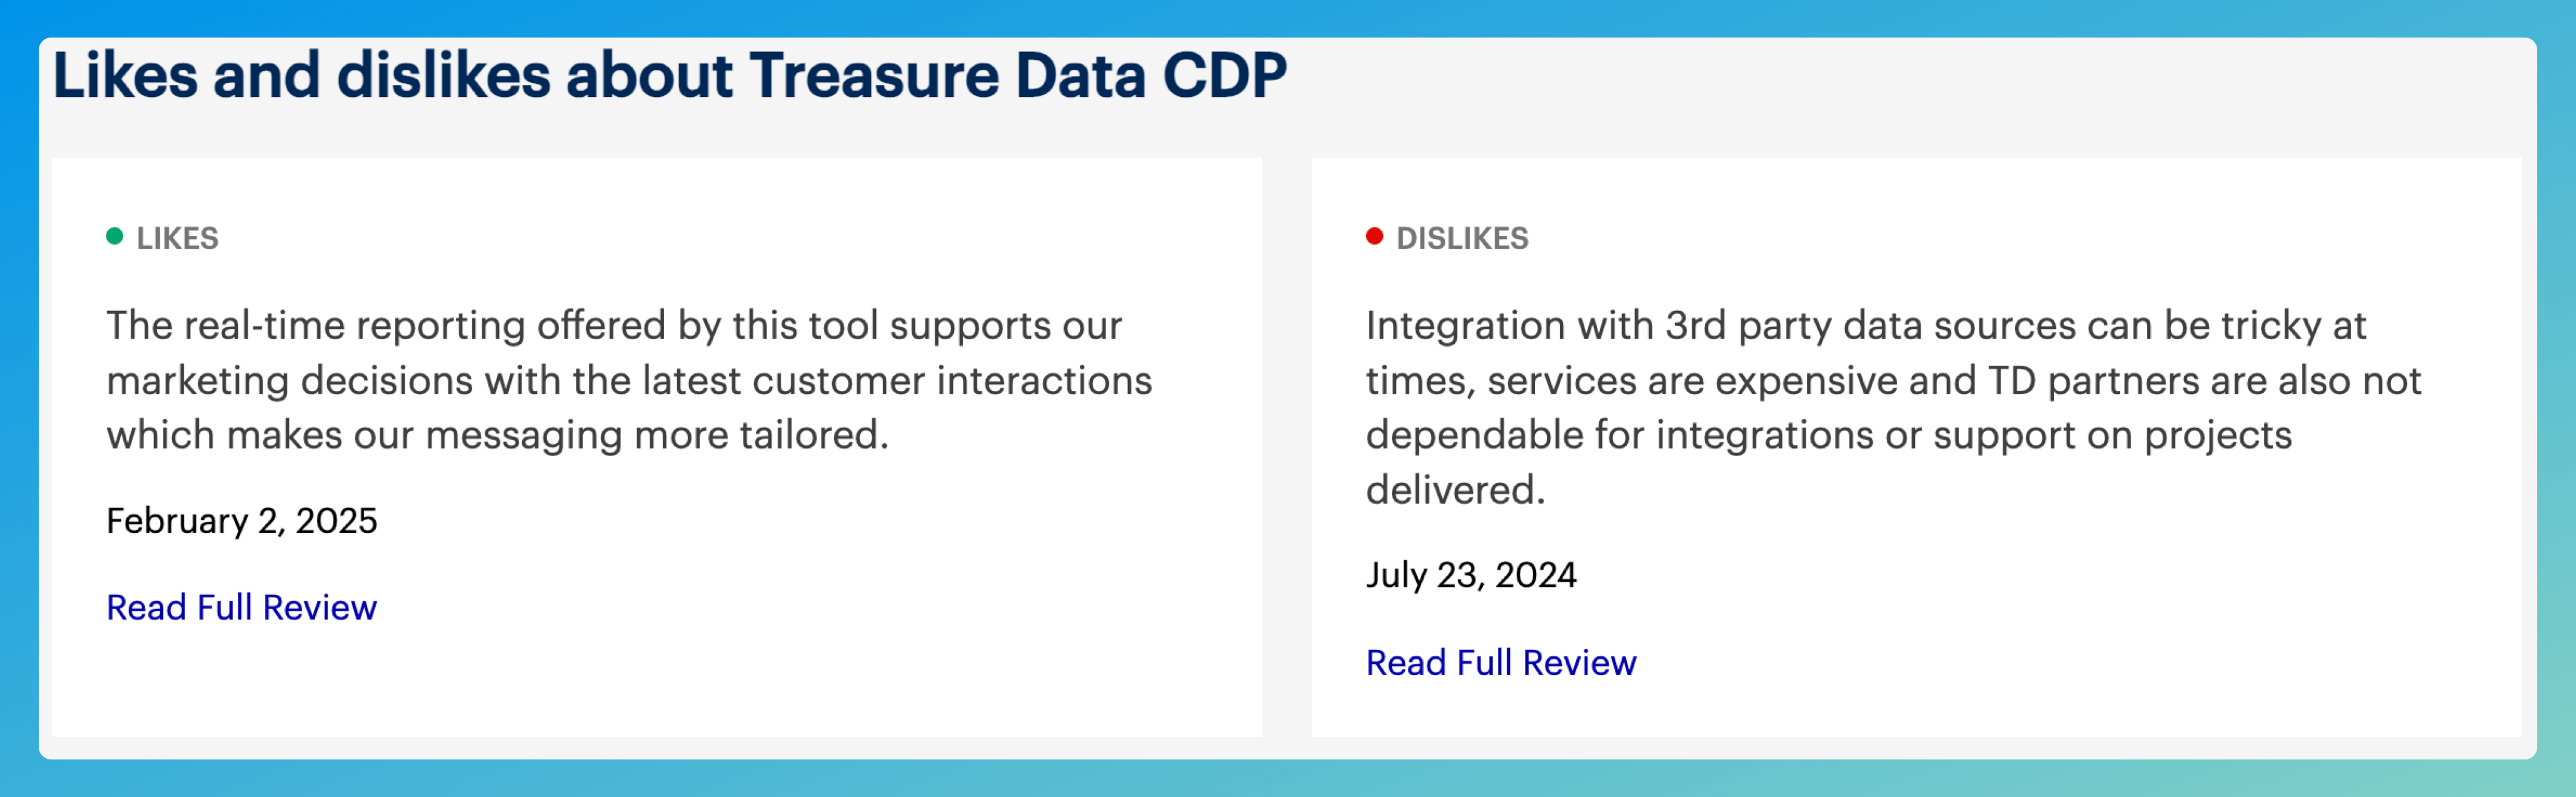
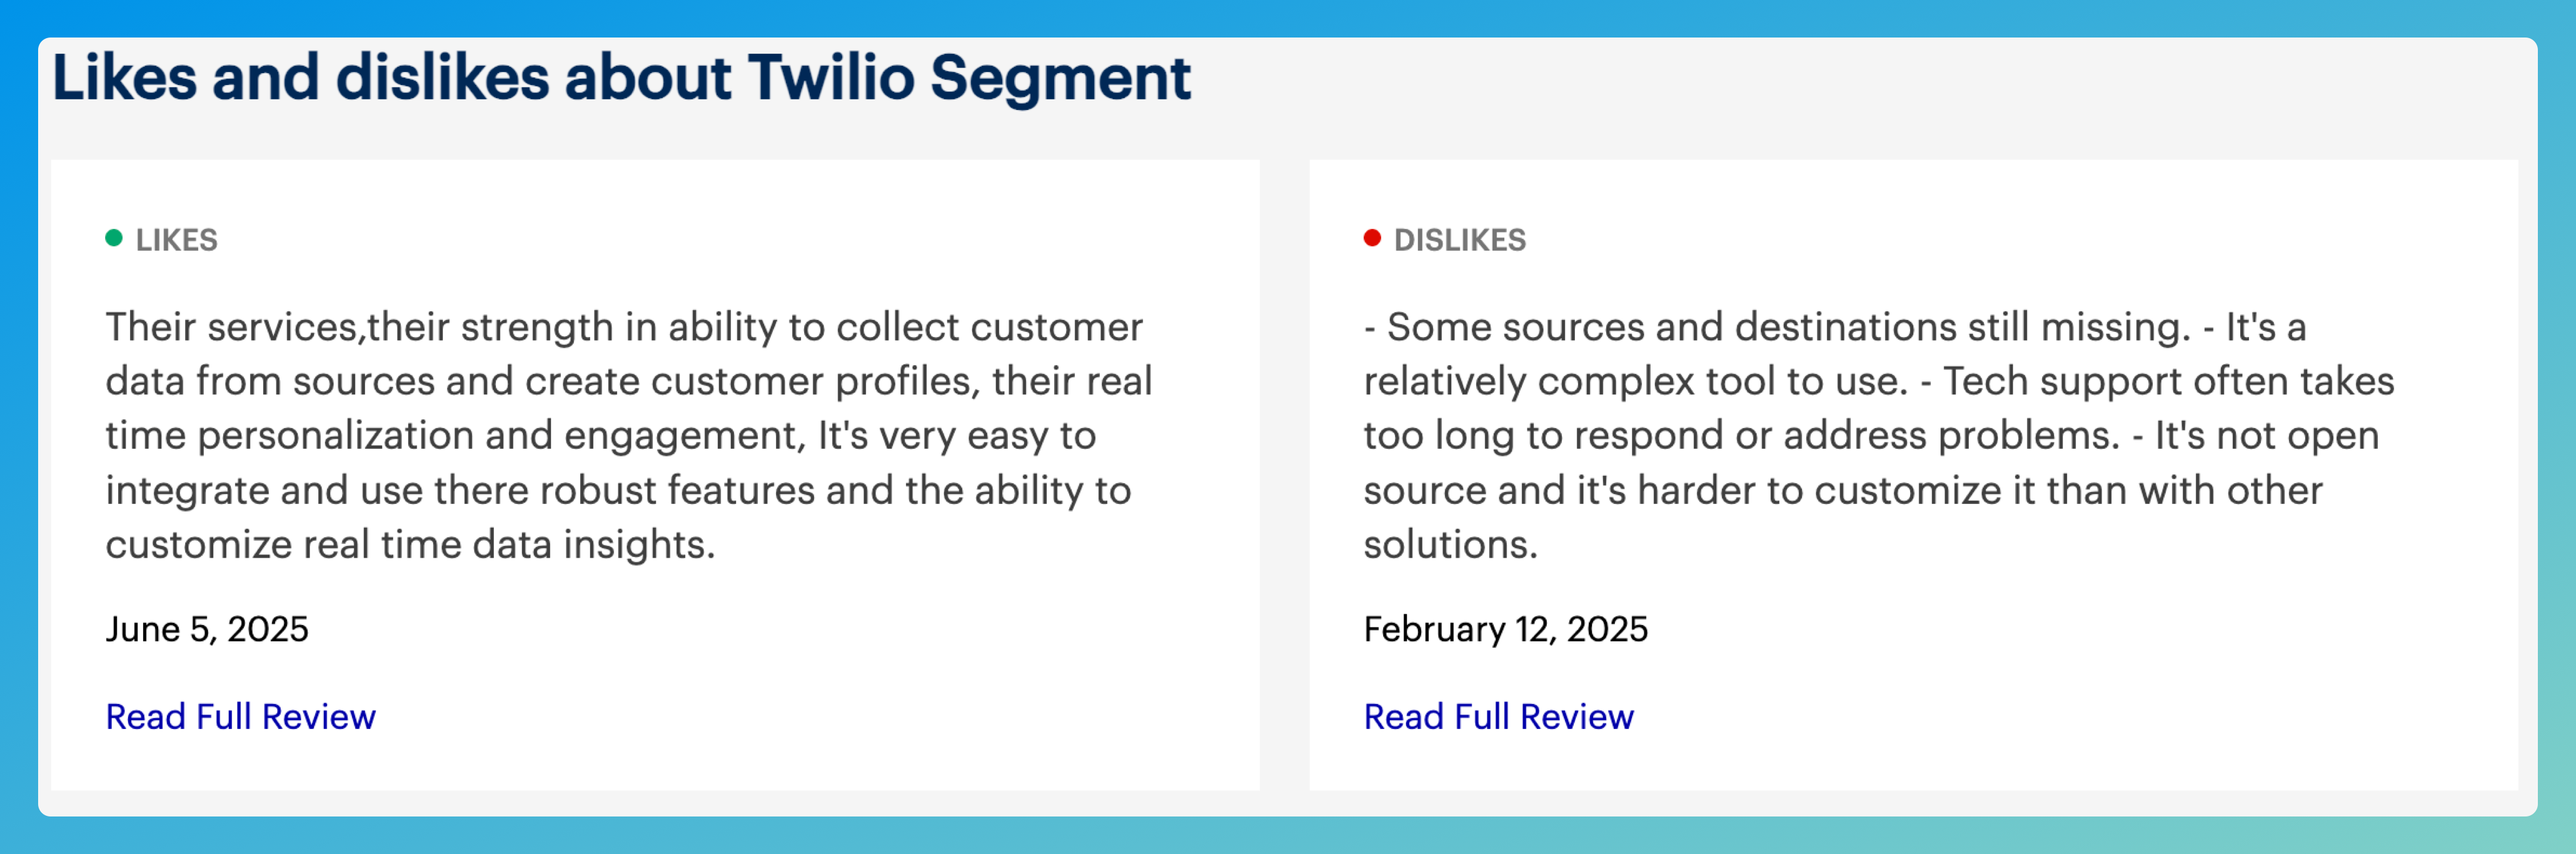
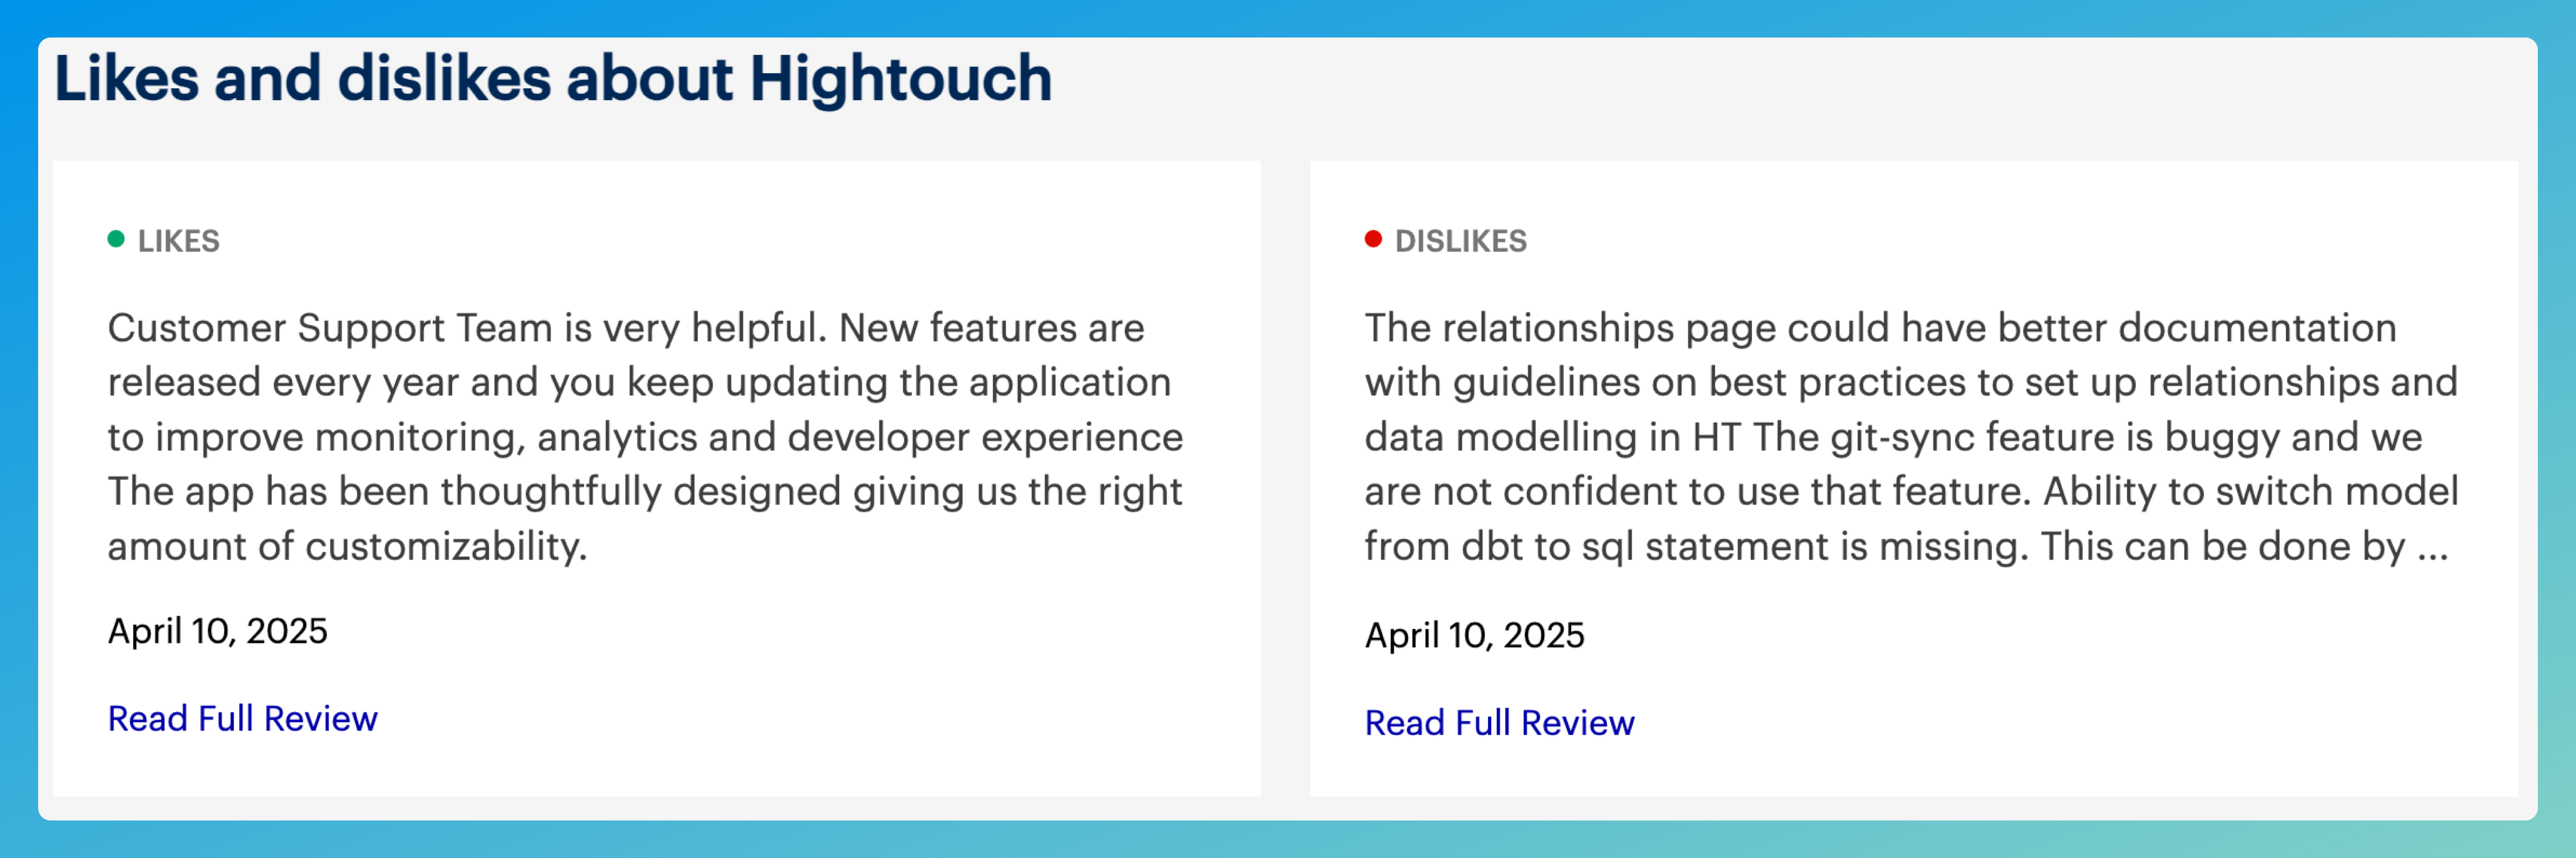
Right off the mark, and as stated earlier, these reviews feel relatable, human, and are filled to the brim with feedback that helps individuals working with the solutions.
Additionally, and I consider this to be a little tongue-in-cheek irony, I observed how Gartner distances itself from the weight many executives place on its charts. The fine print reads:
“Gartner disclaims all warranties, expressed or implied, including any warranties of merchantability or fitness for a particular purpose.”
In other words, they’re not saying these tools will actually work for you. They’re saying these are the vendors who play the analyst game best. The fact that this disclaimer often goes unnoticed only deepens the problem: the quadrant presents a veneer of certainty where none exists.
So, what are we really measuring when we reward platform breadth over operational fit? What does it say about our industry that execution is conflated with expansion, and vision is judged by slide decks more than live deployments? As Tony Byrne of Real Story Group put it,
"none of these [suite vendors] have ever won out when empirically tested by a serious enterprise buyer"
A pointed reminder that what looks good on a quadrant may not hold up under scrutiny.
In part 2, we’ll look at how this dynamic plays out differently depending on where you are and who you are. Because the Magic Quadrant doesn’t mean the same thing in the C-suite as it does to someone trying to build a working segment in less than 10 clicks.
Read the other parts in this Rethinking the Quadrant series
Want to share your own experience of being led or misled by the quadrant? I’m gathering stories from the field. Reach out via LinkedIn or reply on Substack.
Want to receive part 2 in your inbox next week? Make sure to subscribe for free 👇🏻
Discussion