


Just like my previous article, and most because of the fast moving pace of Martech, I revisited some early work.
Back in July I went at whether AI closes the gap in Martec's Law, and part of that piece dealt with the Gartner utilization number. 58% of stack capability in use in 2020, 42% in 2022, 33% in 2023, with the 2025 reading climbing back toward 49% under a slightly different question. Directional rather than gospel, as I put it at the time.
I still think that's right.
What I didn't do is ask why the dead weight is sitting there in the first place.
I assumed it was a features problem. You buy a big platform, you use a quarter of it, the rest gathers dust. That turns out to be the smaller part of it. The bigger one never shows up in a utilization survey at all.
What a contract costs you
Scott Brinker made the point years ago and it has held up better than the statistic it was aimed at.
"If a product gives you great ROI for the subset of features you use that are relevant to your business, does it really matter that other, less relevant features in that product are unused? It's not like there's any physical waste there."
He's right, and it's why the utilization figure never quite bites. If you've licensed a platform for four jobs and those four jobs work, the unused rest costs you nothing extra. It sits there, a bit like the manual for my dishwasher describing cycles I'll never run.
A second contract for a capability you already own is a different animal. That one costs exactly what the invoice says, every month, until someone cancels it.
And it will never appear in a utilization figure, because both platforms are in use. Enthusiastically. By different teams. For the same job.
 Matthew Niederberger
The utilization numbers, and what they cost in attention ⬆️
Eight of them
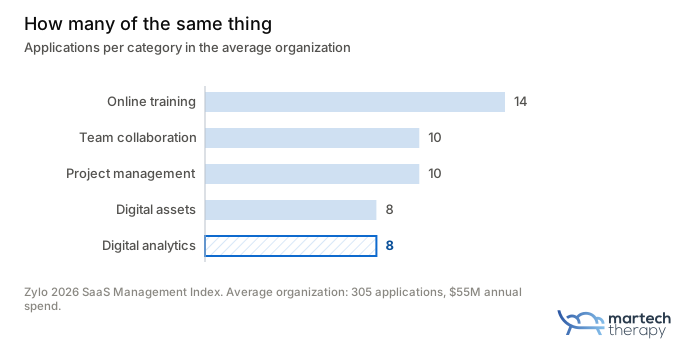
Zylo's 2026 index puts the average organization at 305 applications against 55 million dollars of annual spend. Big numbers wash over you, so skip them. It's the category breakdown that stopped me.
Eight digital analytics applications in the average organization. Eight. Digital asset management, also eight. Project management, ten.
Not eight unused features inside one analytics platform. Eight separate platforms, with eight contracts, eight renewal dates and eight implementations behind them.
To be fair to the sceptics, Zylo sells SaaS management software, so sprawl is their business, and their numbers come from companies who already suspected they had a problem and went looking. Take the precision with a pinch of salt. The direction matches what I find when I go looking myself.
Nobody did anything wrong
Only 13% of applications and 15% of spend sit with IT. So roughly seven applications out of every eight got bought by someone else.
Marketing buys its own tools. So does sales, so does the product team, so does the regional office, and so does whoever inherited a platform through an acquisition nobody finished integrating.
None of those buyers did anything wrong. Each had a real requirement, ran a sensible process, and picked a defensible tool. Duplication is what you get when four sensible processes run at the same time with no shared view of what already exists.
Which brings me to the most useful thing anyone has written about this, and it went out in 1968. Melvin Conway, in How Do Committees Invent?, put it as organizations that design systems being "constrained to produce designs which are copies of the communication structures of these organizations."
Constrained. Not inclined, not tempted. Applied here, your stack mirrors the reporting lines that bought it, and those reporting lines are the more accurate architecture diagram.
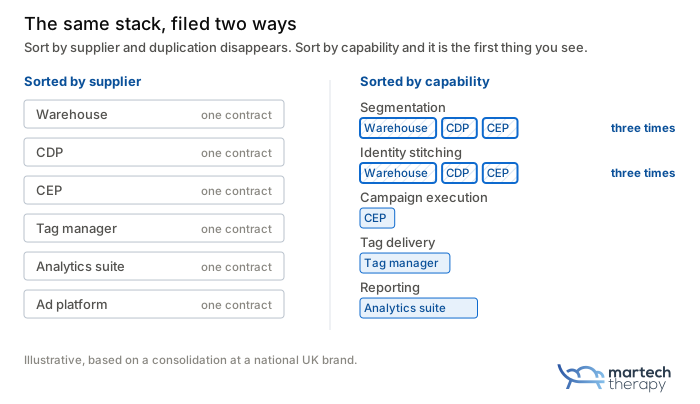
I spent a good while on a consolidation at a national UK brand with exactly that shape. A cloud data warehouse, a packaged CDP, and a CEP. Three platforms, three owning teams, and a functional split that followed the reporting lines rather than anything anyone would draw on purpose.
Three bills
The first is the one everybody expects. Segmentation existed in all three platforms. So did identity stitching, in three flavors, with three definitions of what counted as a match. They were buying the same capability more than once and had been for years.
That one's easy to put in front of a CFO. The second one isn't.
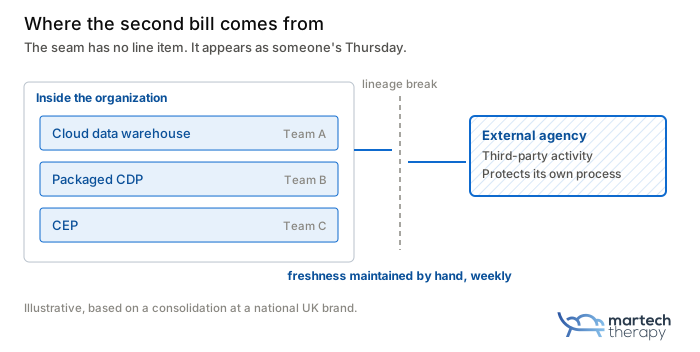
Third-party activity ran through an external advertising agency, and the agency protected its own work the way the internal teams protected theirs. Rational enough, if you think about how an agency earns its position. What it produced was a break in lineage, a seam where nobody could follow a field from source to activation.
Someone has to keep data fresh across a seam like that. In practice that meant standing work for the brand's own team, every week, indefinitely, holding two sides in agreement that would have agreed by themselves if they were one side.
There's no line item for it. It doesn't appear in a renewal negotiation or a cost-per-record calculation. It appears as a recurring task nobody ever closes.
I've written before about stacks and entropy, about a stack absorbing more effort every year to produce the result it once produced easily. Well, this is what that looks like with a receipt attached. A named person maintaining freshness across a gap that exists because two parties are each defending their patch.
Then the third bill, which is the one that stops the other two getting paid down.
Every team had tuned their platform to the point where it worked. Not to the point where it returned anything anybody had measured. To the point where it was operationally acceptable, where campaigns went out and numbers arrived and nobody was firefighting.
A platform you have fine-tuned to operational acceptance feels like something you own. Asking a team to give it up sounds like asking them to go back to firefighting.
Which is why the architecture argument never wins. You're not asking someone to accept a better design. You're asking them to trade a working process for a promise.
Why nobody finds it
Here's the mundane part, and it's why this survives audit after audit.
Every register an organization keeps is sorted by supplier. The contract list, the finance ledger, the SSO application list, the security review queue, the renewal calendar. All of them answer one question, which is who gets paid.
None of them answers what that money bought.
Sort by supplier and duplication vanishes, because the duplicates sit in separate rows under separate names with separate owners. Sort by capability and it's the first thing you see. But nothing in a normal operating rhythm ever asks for that second view.
Except at renewal, occasionally. The Martech Weekly's list of questions a proper renewal review forces includes this one almost word for word. Is the organization paying for duplicated functionality, and is the overlap intentional because it creates resilience, or is it simply waste?
And the money is going somewhere else
Gartner's 2026 CMO Spend Survey went to 401 CMOs between January and March. Martech's share of the marketing budget came in at 19.4%, down from 26.6% in 2021. A five-year low.
Over the same stretch AI arrived as a budget line, and it now takes 15.3% of the marketing budget. For organizations describing themselves as AI-ready, 21.3%.
That's a share though, not a sum. The two move independently. The Martech Weekly's Enterprise Martech Outlook puts 87% of enterprise Martech leaders on flat or expanding budgets for 2026. So the money hasn't gone anywhere. It just arrives with conditions now.
Their sharpest number is the gap. Among teams who can show a measurable contribution to financial objectives, 56% got an increase this year. Among those who can't, 37.5%. Twenty points of funding advantage for being able to prove the case. The base is small enough that I'd call it directional.
I'm not going to claim the Martech money became the AI money. Budgets don't move that cleanly and I've got no evidence for it. What I can say is that one line shrank while another got funded, and in neither direction did anybody stop to work out what was already owned.
70% of those CMOs call AI leadership a critical goal for the year. 30% report the readiness to act on it.
"The risk is that CMOs invest in AI tools faster than they build the data foundations, processes, governance and talent required to scale them." Ewan McIntyre, Gartner
That's a polite description of a gap between structure, capability and process, and I've written enough about that elsewhere.
There's a version of all this that needs no second contract at all. 56% of those CMOs moved more budget onto consumption pricing, and half of everyone who has done that now renegotiates permanently to avoid usage spikes. A quarter are rebuilding systems to use less. Same blindness pointed a different way, where the bill climbs and nothing new got bought.
There's an objection to make here, and their research makes it. The business isn't asking Martech to save money. Revenue growth dominates the strategic objectives and efficiency accounts for 12.2% of the grouped score, so go and find your duplicate spend sounds like the wrong errand.
Except that cancelling a duplicate contract isn't a savings programme. It's the cheapest money in the building, because it needs no business case, no new supplier and nobody's approval, which makes it the easiest way to fund the growth mandate everyone actually has. And it's the last place anyone looks, which is roughly the argument I made when the CDP market started stalling last year.
What actually works
Start with the cheap version.
Take a year of invoices. Rewrite every line as the capability it buys, in plain words rather than the product name. Not the platform, but "sends email and push, holds the campaign logic." Not the warehouse, but "stores customer records, runs the segmentation queries."
Then sort by capability and look at the collisions. That's the whole exercise. You don't need software for it, though I'll admit I built some, because doing it by hand across three hundred applications is a weekend I'd rather not repeat.
The list tells you where the overlaps are. It won't tell you what to do about them, and this is where most consolidation projects die.
Because the answer is almost never cancel the cheaper one. Both teams have real work running on their platform, both have tuned it to acceptable, and neither's going to concede because your diagram looks tidier.
What moved it at that UK brand was turning each overlap into a cost benefit estimate. Not an architecture score. Money. What does running identity stitching in three places cost, in license and in the hours spent reconciling three answers, against running it in one? Put that number in front of both teams and the argument stops being about whose platform is better.
Some of those estimates came back saying keep both, by the way. That's a legitimate result and worth stating, because an exercise that can only conclude "consolidate" was never an analysis.
Anyway. Consolidation run as a procurement exercise fails. The duplication was never a procurement problem. It was a structural one, and structure doesn't respond to a spreadsheet of license costs on its own.
Where I would leave it
The utilization number will keep getting quoted, and it'll keep pointing at unused features, which cost nothing.
Meanwhile the average organization runs eight analytics platforms, seven of every eight applications got bought outside IT, and there's an AI line to fund out of a budget that now comes with conditions attached.
The capability-sorted list tells you where the money is. It's the least glamorous item on anyone's roadmap this year, which is probably why it's still available.
If you'd rather not do it by hand, the overlap scan runs the capability sort for you. No signup, no wall.

Take your free Martech Stack scan today.
Find overlaps and hidden cost savings.
No sign-up, no costs.
Discussion