


You already grade your stack. You do it every time someone asks how it's going, and the answer changes depending on who's asking.
The board gets "maturing, nothing structural." Your data engineer gets "held together with string." Both are honest. Neither is written down.
Writing it down is the only thing that closes the gap. And the trouble starts there, because every framework you can reach for was published by someone with a position.
Everybody's framework is selling something
I went at this in July, looking at how the agentic CDP got defined.
The definition ranking top of the search results belongs to cdp.com, an independent resource in its own description and a Treasure AI property in its footer. It runs a five-point test. The criteria happen to describe how Treasure AI is built. Treasure AI then scores five out of five, Databricks two to three, Hightouch one.
A test written by a vendor, which the vendor passes perfectly, and its largest rivals fail.
I still stand by that. I'd add that it isn't unusual. It's the normal condition of this market. The analyst quadrants, the vendor maturity models, the readiness assessments that arrive as a friendly PDF: every one of them was published by an organization with something to gain from where you land.
 Matthew Niederberger

Including this one
The scorecard I will present is mine. It's the scoring model inside Martech Stack Builder, which I sell. Discount it accordingly.
Then run it by hand, without an account.
If it only works once you sign up, it was marketing.
What it looks at
Six dimensions, adding to a hundred, and they don't count equally.
- Architecture quality is the heaviest at twenty-five percent. It asks whether the joins make sense, or whether the same data crosses the same boundary four times on its way to being useful.
- Data flow efficiency takes twenty, which is really a question about how much copying and reconciling has to happen before anyone can answer something simple.
- Tool selection, also twenty. Not whether you bought good tools, but whether each one is doing the job it's best at rather than the job it was bought for three years ago.
- Integration health, fifteen. The honest version of that question is what breaks when one connection fails, and how long it takes anyone to notice.
- Scalability gets ten. What happens at ten times the volume.
- Operational health has the last ten. Whether the people who own it can actually run it.
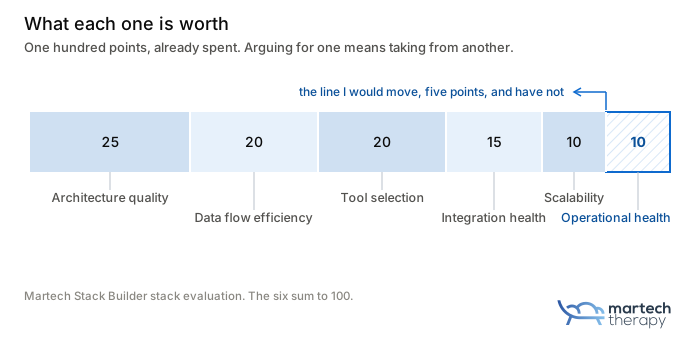
What each one is worth
Naming six things worth looking at is easy, and every consultant has a version.
So why would you argue with anyone's list?
You wouldn't. The numbers are what you argue with.
So here's mine. Architecture is worth two and a half times scalability.
An architecture mistake bills you every day. It shows up as reconciliation work, as two dashboards that disagree, as a person whose week goes on keeping two systems telling the same story. A scale ceiling bills you once, loudly, on the day you hit it, and plenty of organizations never hit it at all.
So you pay to avoid a problem you might never have, and keep paying for the one you already have.
A scorecard that won't say what each thing is worth is a list.
The seam I described in the last piece is the example.
A brand paying a person every week to keep data fresh across a gap between systems, because two parties were each protecting their own patch. Nothing about that was a scale problem. It was an architecture problem, invoiced weekly to a person, and no capacity planning exercise would ever have caught it.
The one I'd argue with
Operational health at ten percent is probably wrong, and I think it's too low.
Here's what moved me.
In that same consolidation, the thing that stopped anything happening wasn't the architecture and it wasn't the money. Every team had tuned their platform to the point where it worked, and a platform you've tuned to that point feels like something you own.
Nobody hands that back for a tidier diagram.
If that's the strongest predictor of whether a stack ever actually changes, then a tenth is far too little. A stack that grades well on paper and cannot be moved by anybody is not a good stack.
I haven't settled where it should sit.
North of fifteen, at the expense of scalability, is my instinct. I'd rather say that out loud than hand you six numbers as though they arrived from somewhere neutral.
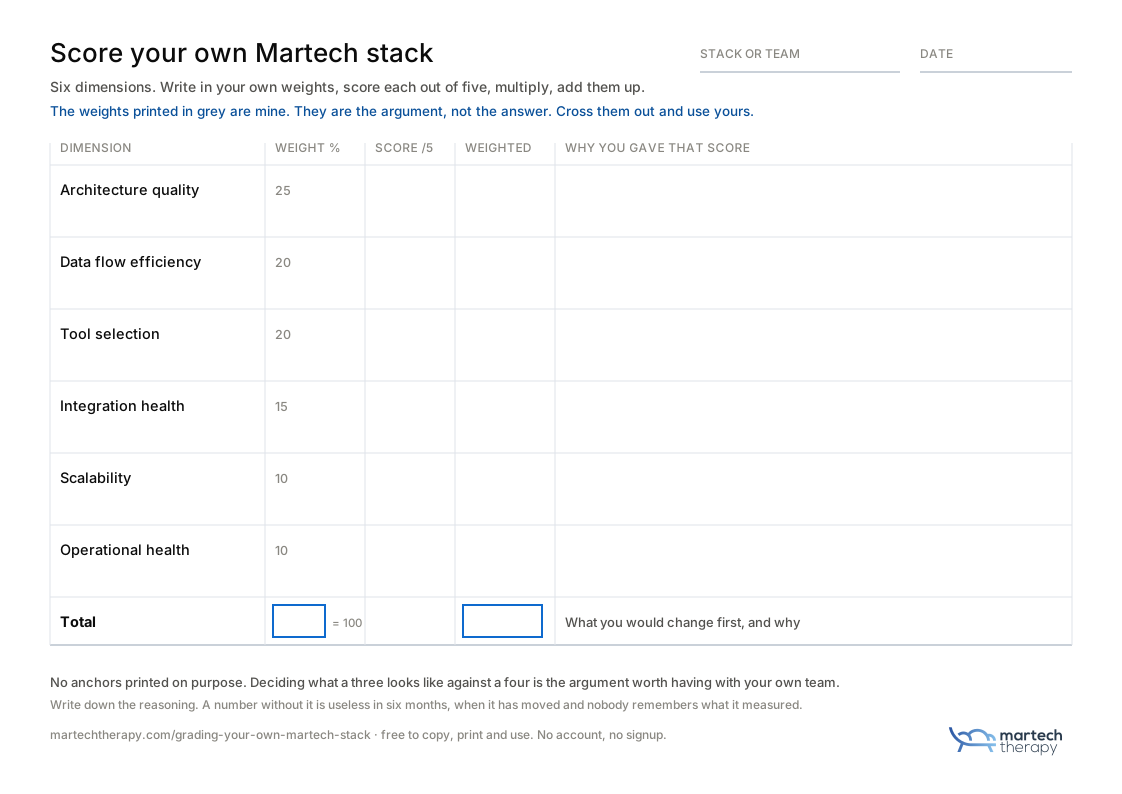
Do it on paper
Score each dimension out of five.
Multiply by the percentage.
Add them up.
That's the number.
The scoring isn't the hard part. Deciding what a three looks like against a four is. Have that argument with your own team. If your architect and your campaign manager score integration health four points apart, the disagreement taught you more than the total will.
So here's one, worked through, using the dimension people score most generously.
A five on integration health means every connection has an owner, a failure alerts a person who can fix it, and you could say out loud what breaks downstream if it stopped tonight.
A three means the connections work, most of them have an owner somewhere, and you'd find out about a failure when a campaign looked wrong.
A one means you're running integrations nobody has looked at since the person who built them left.
Most stacks score themselves a four and are a three. The tell is the last part of that five. Not whether it works, but whether you know what happens when it doesn't.
Write down why you gave each score. A number without its reasoning is useless in six months, when it has moved and nobody remembers what it was measuring.
If you'd rather not do it by hand, the evaluation runs inside Martech Stack Builder against a stack you've already mapped, and it produces the same scores faster.
The paper version, see my free downloadable PDF template below, is the real one though. The tool is only quicker.
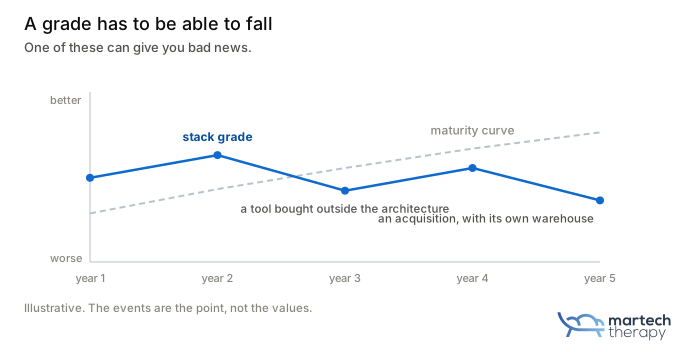
A grade has to be able to fall
Here's my test for whether a framework is an instrument or a marketing device.
Can your score go down?
Most published frameworks travel in one direction.
Nobody scores lower next year, because the model was built to show progress, and a chart that goes down doesn't get shared. That's what makes maturity pyramids decorative. They can't deliver bad news.
A stack grade should be able to drop, and it should drop for reasons you can name.
- Someone buys a tool outside the architecture.
- A team stops maintaining an integration nobody owns, and nobody notices until a campaign breaks.
- An acquisition arrives with its own warehouse.
If none of that moves your number, your number isn't measuring the stack.
What the number is for
Not for a slide, cowboy.
The point of scoring your own stack is that you come out holding an opinion you can defend, with the reasoning attached, on the day someone asks you to justify a renewal or refuses you budget.
The Martech Weekly's enterprise research found 40.2% of Martech leaders can't show a measurable contribution to financial objectives. A stack grade won't fix that, because it measures the machine rather than the return.
What it does is explain the shortfall.
Proving what your Martech contributed is difficult when the joins are poor, the same data gets reconciled four times, and nobody owns the integration that broke.
A number you worked out yourself, from a method you're free to disagree with, beats one handed to you by someone with a stake in the result.
Mine included.

Start managing your Martech Stack architecture today 👇🏻
Discussion